By Dan Patrinos
Living on the nineteenth floor of a high-rise on a Lake Michigan bluff is the perfect perch to view the lake’s range of emotions. With a sweep of perhaps thirty miles, I’ve seen both ends of rainbows, placid blue water change from jade green to pewter gray, and isolated storms on the horizon.
All that contrasts with the dynamics of record-breaking high water leaping and gnawing at marine works, and aggressively eroding shorelines, bluffs and coastal roadways.
Water levels are primarily determined by regional climatic conditions, which influence the levels of the five Great Lakes, the largest freshwater system in the world. The US Army Corps of Engineers reports that the primary driver of water level fluctuation is the combined effects of rain and snow falling on the lakes’ basin, runoff draining into the lakes, and surface water evaporation. The flow of the St. Marys River into Lake Huron is an added factor affecting that lake and Lake Michigan.
–––––––––––––––––––––––
Visit WMHS on Facebook
–––––––––––––––––––––––
In January 2013, Lakes Superior and Michigan-Huron were in the midst of a fourteen-year streak of below average levels, the Corps states in its semi-annual Great Lakes status report. Not only did Lakes Michigan-Huron drop to their lowest level that month, it was at its lowest since 1918, when official record-keeping began, per the report.
Lakes Michigan and Huron are hydraulically considered to be a single lake because they are connected at the Straits of Mackinac.
2013 was a turning point: above average precipitation led to a rise in all the lakes that spring and summer. The 2013-2014 polar vortex, the giant low pressure area at the North Pole, triggered record-low temperatures and record and near record snowfall over the Great Lakes.
“The harsh winter produced record-high ice cover …. The cooling of the lake surface by the bitterly cold temperatures and record-high ice cover lowered lake surface temperatures, moderately depressing evaporation in spring and summer,” the report says. With reduced evaporation and abundant runoff from the snowmelt, the Great Lakes witnessed an above average water supply in April, May, and June 2014.
* * *
From 2013 to 2017, Lake Superior’s annual precipitation was above average each year –– “the first time it had been above average five years in a row since the record-high water level period of the mid-1980s,” the report states. For Lakes Erie and Ontario the annual precipitation was above average most of those five years. While closer to average than the other lakes, the annual precipitation for Lakes Michigan-Huron was below average only one year during that period.
Between January 2013 and May 2019, the Great Lakes experienced record-high levels. Lakes Superior, Erie and Ontario matched or set numerous record high monthly mean levels in 2019. In June of that year, Lakes Erie and Ontario climbed to their highest monthly mean level since 1918. The Corps states that heavy precipitation contributed to Lakes Michigan-Huron coming within an inch of record levels in June, July and December 2019.
Quoting the National Weather Service, the Corps reports that Wisconsin – much of it in the Lakes Superior and Michigan-Huron basins – had above average precipitation from 2013 to 2019. “Three of the state’s top five wettest years have taken place in the past 5 years (2015-2019),” according to the Corps. Data from the Midwest Regional Climate Center show that precipitation in 2018 in the Midwest region, which includes six Great Lakes states, was the highest in the Center’s records.
* * *
Underscoring that statement, the Corps reports that the US National Centers for Environmental Information’s estimated precipitation in the US portion of the Great Lakes basin from 2015 to 2019 was the highest five-year total since the start of its record-keeping in 1895.
By the end of 2019 the lakes were 13 to 36 inches above their long term averages.
Based on preliminary stats for 2020, Lakes Michigan-Huron set monthly mean record highs for January, February, March, April and May 2020. Lakes Michigan-Huron jumped from 576.02 feet to 581.5 feet between January 2013 and January 2020.
This month the Corps announced that despite seasonal declines, the Great Lakes remain high as autumn storms approach. “The Corps of Engineers urges anyone impacted by high water levels last fall to prepare for similar or worse impacts in the coming months,” John Allis, Detroit District Great Lakes hydraulics and hydrology office chief, said.
* * *
Here is the US Army Corps of Engineers’ complete July 2020 Great Lakes Update, Vol. 206: From Record-Lows to Record-Highs in 6 years
* * *
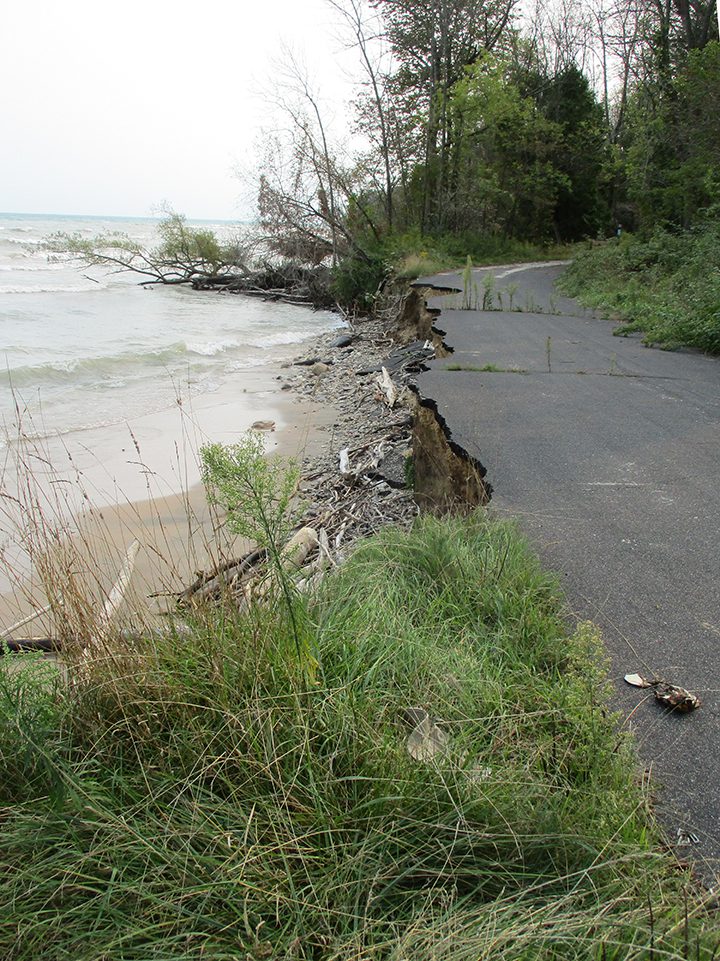
Photo: Taken in mid-September, the image on this page shows water damage at Harrington Beach State Park, which has more than a mile of beach along Lake Michigan.
(Photo Credit: James Heinz)
Dan Patrinos is a retired journalist and a member of the Wisconsin Marine Historical Society. He lives in Milwaukee.